Wrzuciłem sobie appke na VPSa - testowa z golang i htmx, ciekawe jakie będą wyniki pod większym obciążeniem


Gdyby ktoś chciał powysyłać requesty: http://57.129.42.138/
Logi zapisuje do pliku to potem sobie sprawdzę.

Maszyna 4CPU + 8GB RAM


#programowanie #gownowpis

e22ae82d-d8d6-4e46-b4f1-1f251a44e1d6

Komentarze (9)

@Knight Zrobiłem Apache Bench - po 2000 się przytyka. Łap raport:
```
This is ApacheBench, Version 2.3 <$Revision: 1879490 $>

Copyright 1996 Adam Twiss, Zeus Technology Ltd, http://www.zeustech.net/

Licensed to The Apache Software Foundation, http://www.apache.org/

Benchmarking 57.129.42.138 (be patient)

Completed 1000 requests

Completed 2000 requests

Completed 3000 requests

Completed 4000 requests

Completed 5000 requests

Completed 6000 requests

Completed 7000 requests

Completed 8000 requests

Completed 9000 requests

Completed 10000 requests

Finished 10000 requests

Server Software:

Server Hostname: 57.129.42.138

Server Port: 80

Document Path: /

Document Length: 1396 bytes

Concurrency Level: 100

Time taken for tests: 77.008 seconds

Complete requests: 10000

Failed requests: 0

Total transferred: 15140000 bytes

HTML transferred: 13960000 bytes

Requests per second: 129.86 [#/sec] (mean)

Time per request: 770.076 [ms] (mean)

Time per request: 7.701 [ms] (mean, across all concurrent requests)

Transfer rate: 192.00 [Kbytes/sec] received

Connection Times (ms)

min mean[+/-sd] median max

Connect: 24 695 2259.1 39 67972

Processing: 25 41 21.2 36 276

Waiting: 22 35 10.5 33 271

Total: 52 736 2258.4 78 68008

Percentage of the requests served within a certain time (ms)

50% 78

66% 100

75% 1072

80% 1085

90% 2102

95% 3128

98% 5192

99% 11286

100% 68008 (longest request)

```

@Knight
Trzysta równoczesnych:

Server Software:

Server Hostname: 57.129.42.138

Server Port: 80

Document Path: /

Document Length: 1396 bytes

Concurrency Level: 300

Time taken for tests: 75.315 seconds

Complete requests: 10000

Failed requests: 0

Total transferred: 15140000 bytes

HTML transferred: 13960000 bytes

Requests per second: 132.78 [#/sec] (mean)

Time per request: 2259.461 [ms] (mean)

Time per request: 7.532 [ms] (mean, across all concurrent requests)

Transfer rate: 196.31 [Kbytes/sec] received

Connection Times (ms)

min mean[+/-sd] median max

Connect: 24 1757 5365.1 73 68422

Processing: 26 56 94.9 37 3496

Waiting: 23 47 66.0 33 1254

Total: 52 1813 5360.3 148 68456

Percentage of the requests served within a certain time (ms)

50% 148

66% 1077

75% 1096

80% 2098

90% 3177

95% 11253

98% 19650

99% 19839

100% 68456 (longest request)

@ataxbras O, dzięki! Miałem w planach odpalać jMeter, ale wyłączyłem już kompa i idę spać. Aż się zdziwiłem że nadal działa przy 300 równoległych, jak to stoi na gołym vpsie, a tu nawet response time 2.2s xD

@Knight No, choć na pierwszy rzut oka to nie jest bardzo złożona usługa, więc nie mieli zbytnio. A ab w standardzie śle zdaje się option, więc to nie zajmuje dużo, jeśli serwerek nie jest spieprzony (poza tym golang jest całkiem dobry w te klocki).
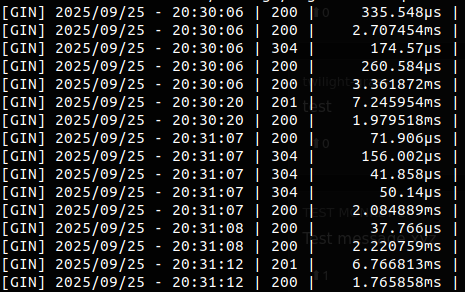
Zobacz logi i daj znać, czy coś tam się działo. Fakt, że requesty się cięły konsekwentnie po jakiś 2000 sztuk w obu przypadkach, więc jakiś load był.

@koszotorobur Właściwie to do niczego, chciałem coś wyklikać w gin + htmx i sprawdzić jak działa, nigdy wcześniej żadnego z wymienionych nie używałem

Zaloguj się aby komentować