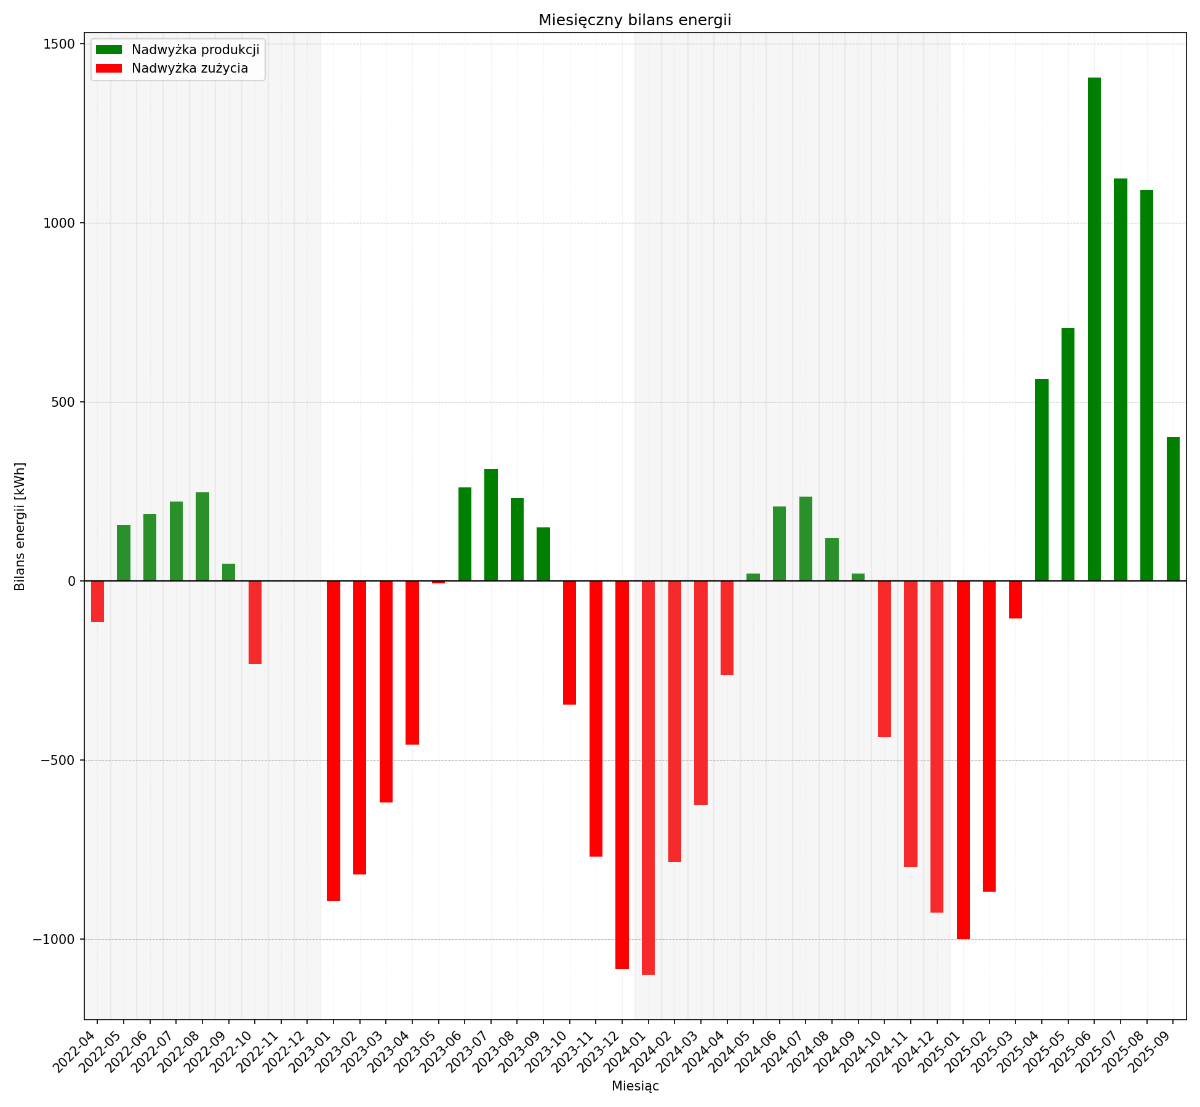
Poprawiłem sobie wykresik bilansu energii dla mojego gospodarstwa domowego, jestem z siebie dumny więc wrzucam żeby się pochwalić #stepujacybudowlaniec
KOD:
#!/usr/bin/env python3
import psycopg
import pandas as pd
import matplotlib.pyplot as plt
from matplotlib.patches import Patch
# ---- KONFIGURACJA BAZY ----
DB_NAME = "rachunki_prad"
DB_USER = "raport_reader"
DB_PASSWORD = "bezpieczne_haslo"
DB_HOST = "192.168.123.11"
DB_PORT = "5432"
# ---- POŁĄCZENIE Z BAZĄ ----
conn = psycopg.connect(
dbname=DB_NAME,
user=DB_USER,
password=DB_PASSWORD,
host=DB_HOST,
port=DB_PORT
)
# ---- POBRANIE SUM MIESIĘCZNYCH ----
query = """
SELECT
to_char(date_trunc('month', date), 'YYYY-MM') AS month,
SUM(b0 + b1 + b2 + b3 + b4 + b5 + b6 + b7 + b8 + b9 + b10 + b11 +
b12 + b13 + b14 + b15 + b16 + b17 + b18 + b19 + b20 + b21 + b22 + b23) AS total_bilans
FROM energy_balance
GROUP BY month
ORDER BY month;
"""
df = pd.read _sql(query, conn)
conn.close()
# ---- PRZYGOTOWANIE DANYCH ----
df["month"] = pd.to _datetime(df["month"], format="%Y-%m")
df = df.set_index("month").sort_index()
# przelicz Wh → kWh i odwróć znak (żeby dodatni bilans był produkcją nad osią)
df["total_bilans"] = -(df["total_bilans"] / 1000)
# ---- UZUPEŁNIENIE BRAKUJĄCYCH MIESIĘCY ----
full_index = pd.date _range(df.index.min(), df.index.max(), freq="MS")
df = df.reindex(full_index, fill_value=0)
df.index = df.index.strftime("%Y-%m")
# ---- WYKRES ----
fig, ax = plt.subplots(figsize=(13, 12)) # 2x wyższy wykres
colors = df["total_bilans"].apply(lambda x: "green" if x >= 0 else "red")
bars = df["total_bilans"].plot(kind="bar", color=colors, ax=ax)
# linia zerowa
ax.axhline(0, color="black", linewidth=1.0)
#
ax.grid(True, axis="y", linestyle="--", linewidth=0.5)
ax.grid(True, axis="x", linestyle="--", linewidth=0.3, alpha=0.3)
ax.set_axisbelow(True)
#
for i, label in enumerate(df.index):
year = int(label[:4])
if year % 2 == 0: # parzysty rok
ax.axvspan(i - 0.5, i + 0.5, color='lightgray', alpha=0.2)
# opisy i tytuł
ax.set_xlabel("Miesiąc")
ax.set_ylabel("Bilans energii [kWh]")
ax.set_title("Miesięczny bilans energii")
# legenda
from matplotlib.patches import Patch
legend_elements = [
Patch(facecolor="green", label="Nadwyżka produkcji"),
Patch(facecolor="red", label="Nadwyżka zużycia")
]
ax.legend(handles=legend_elements, loc="upper left")
plt.xticks(rotation=45, ha="right")
plt.tight_layout()
plt.savefig("raport_miesieczny_bilans.png", dpi=150)
plt.show ()